Customer Profiling and Saturation (Ref: BM-103)
Universe and Customer Profiling
Consider the scenario in Illustration 1; the green points are retail establishments surveys in Quezon City, and the red points are the current customers of a particular company selling soap.
By having a visual representation of customers and target markets (universe), it is really easy to spot distribution gaps as illustrated below.
- A key way to measure saturation is through customer profiling.
- Each customer location is mapped out and compared against a universe of potential customers.
- In the case of (Illustration 1), one can clearly see the gaps in distribution, just by pure density alone.
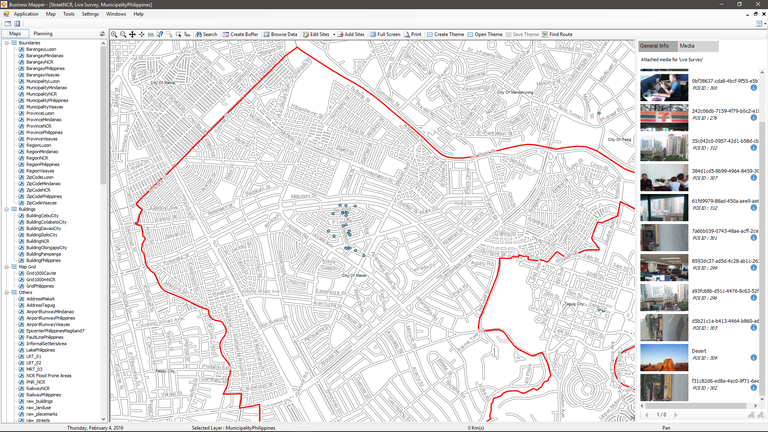
What about mapping resources?
Business Mapper enables its customers to just use the existing field force or field personnel. No need for external help. (refer to Real Time Mapping)
Illustration 1: (Quezon City Retail Establishments Survey)
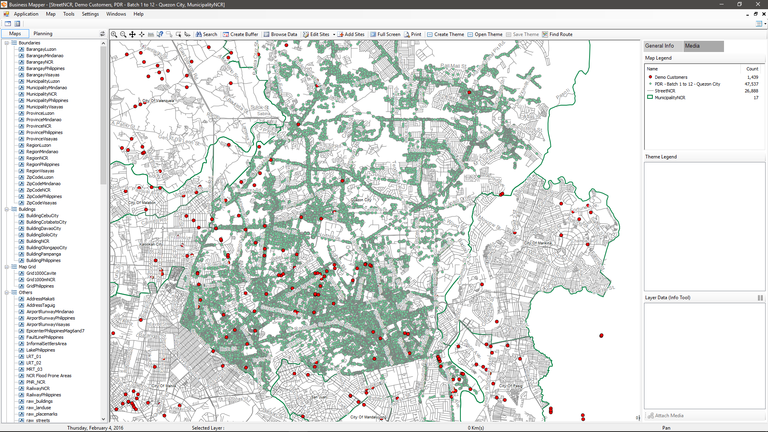
Illustration 2: (Mapping with Photos, Establishments Survey in Makati)
Note: If this article leads to you making an inquiry to us, please use reference RE: BM-103 when you email us with your inquiry.
Business Mapper Team